Curriculum 'User Guide Viedoc 4'
Overview of the landing page Download PDF
1 The landing page
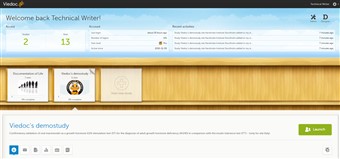
- The landing page is where you end up after logging in. If you have access to several studies you are able to choose between these studies on the landing page. If you are an administrator and/or designer you will also have access to Viedoc Admin and Viedoc Designer from the landing page.
- Click a study icon to select a study to work with.
- Video tutorial: Overview of the landing pageClick the link to watch the video.
2 Start page
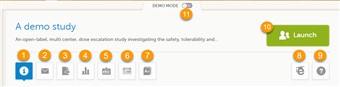
- The start page of every study contains the following icons that give access to different features, or enable you to view information about the study (see image).
1. Study status
2. Messages
3. Export of data
4. Metrics
5. Roles
6. Reference Data
7. Medical Coding
8. eLearning
9. Support
10. Launch button
11. Demo mode ON/OFF
The icons are described one by one below. - The export, metrics and medical coding icons, the demo mode switch, and the launch button are only visible if you have access to the respective features. Whether you have access to these features, depends on the role assigned to you, and on the permissions that are included in your role. Roles and permissions are set up in the study design.
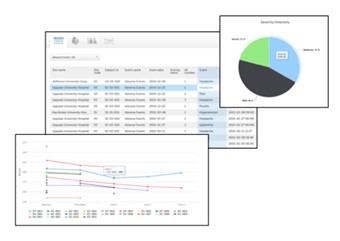
3 Study status (1)
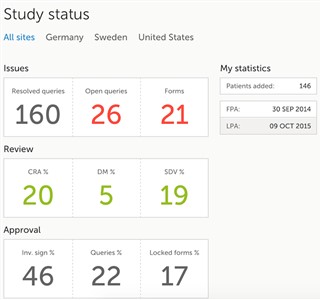
- The first page that is shown when accessing a study is the study status page. This page gives you an overview of the progress of the study - on study, country and/or site level (depending on which sites you have access to).
- The information provided in the boxes show important metrics, such as: • number of open queries • number of forms with issues • the amount of work performed (in percentage) for different user roles • amount of data signed • when last signing was performed, actual recruitment etc.
- You can filter the displayed data for country or site by clicking the name of the country or site.
4 Messages (2)
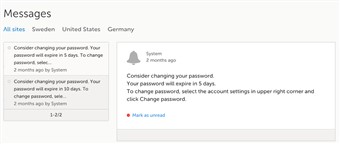
- A message can either be a system message or a study message. An example of a system message is "Your password is about to expire". An example of a study message is "A serious adverse event has been added to the study".
- Study messages that are judged important are normally configured to be sent also as emails.
- An indicator in the top bar of the application indicates whether you have unread messages.
5 Export of data (3)
- The data export page enables you to review and download study data in various formats, such as Excel, CSV, SAS, PDF and CDISC ODM.
- Data export might not be available to all users.
- For more information about data export and preview, see Data export and Data preview.
6 Metrics (4)
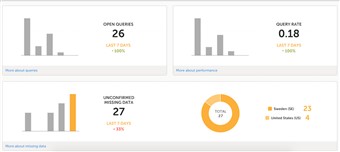
- The metrics feature gives an overview of the quality of data in terms of open queries and missing data. You can filter the displayed data by country and site to monitor country or site performance.
- Metrics might not be available to all users.
- The metrics graphs depict: • open queries • query rate • number of unconfirmed missing data items. The column graphs show five bars indicating the trend during the past five weeks, where each bar indicates a seven day period. The orange bar depicts the most recent seven days, starting from today. The grey bars depict earlier 7-day-periods. The percentage indicates the trend of the recent seven days as compared to the previous 7-day-period. For example, +10% means that in the recent seven days, 10% more queries were in the state 'raised' as compared to the previous 7-day-period.
- Click More about [...] to open a page with detailed metrics about queries, performance or missing data. All detailed metrics pages include filtering possibilities and a bar to show the review status.
- You can save all detailed metrics graphs in PDF format and download the PDF for sharing. You can also send an email to your registered e-mail address with the PDF file as attachment.
7 Roles (5)
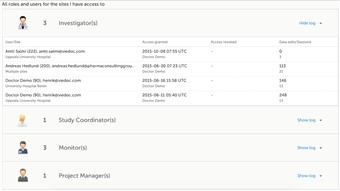
- The Roles page provides information on the roles that are assigned to you. It also lists all the roles that are, or have been, used at the sites you have access to.
- To see user details of each role, click Show log. The log displays:
• name of the user, e-mail address and site,
• when and by whom access was granted,
• when and by whom access was revoked (if applicable),
• whether the user edited any data, and the total number of login sessions* by the user.
*number of sessions is defined as number of times a user has accessed the study. - You can download the user and roles PDF report by clicking the Download log of users and roles as a PDF file in the bottom of the page.
The report contains information about all the users and roles for the sites you have access to, grouped in the following chapters:- 1. Summary - the summary of active/inactive roles, active/inactive users as well as data contributors, grouped in one section per site.
- 2. Roles - lists the permissions associated with each role and corresponding history, grouped in one section per site.
- 3. User log per site - list of all users who ever had access to data, including user activity, grouped in one section per site.
- 4. User account logs - lists the change history of all user accounts for the users listed in the above sections of the report, grouped per user (identified by the User ID)
- How is this information useful? Let's say you want to check that only authorised users have contributed to the data. This information can easily be found in the log.
8 Reference data (6)
- When you click the reference data icon, the list of available reference data source - scope combinations is displayed. From here you can open the reference data editor. For details see Reference Data in Viedoc Clinic.
9 Medical coding (7)
- The medical coding feature allows you to code reported events like Adverse Events, Medical History and Concomitant Medications. When you click the medical coding icon, the page displays metrics regarding medical coding. There is one set of metrics for each medical coding scope available.
- Medical coding might not be available to all users.
- For more information about medical coding, see the Medical Coding Use Case.
10 eLearning (8)
- Under this section you have access to what you are reading right now, the eLearning.
Depending on the roles that have been assigned to you, you might have access to several eLearning programs. - Tip! The various lessons in the eLearning can easily be compiled into a PDF and printed if you need to store them in the investigator binder.
11 Support (9)
- Click the support icon to open a pop-up with contact details to the users that can help you in case you need support. Normally you would find the contact details of the monitor here, as the monitor typically is the first point of contact to the site.
12 Launch (10)

- Click the Launch button to access the patient data and eCRFs.
- The launch button is only visible when you have access to the study in Viedoc Clinic.
- If multiple roles are assigned to you in this study, you are first prompted to select the role you would like to use to access the study.
13 Demo mode (11)
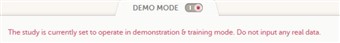
- If enabled, a study can operate in demo/training mode. You can easily switch between demo/training mode and production mode using the demo mode switch.
- The demo mode switch is only visible when you have access to both the production and demo mode.
- The demo/training mode is clearly indicated with demo icons. Make sure you do not enter any real data in demo/training mode!
- Video tutorial: Training/Demo mode Click the link to play the video.