Data preview Download PDF
1 About the preview of data
- The data export page enables you to review and download study data.
- You can filter and select the data by: • Country and site • Subjects to include • Events and time period • Forms and items • Type of data For more information about the selection of data and data export, see the eLearning section about Data export.
- Using the preview feature, you can preview the data in Viedoc, and create different types of graphs from the data. It is also possible to directly access the underlying eCRF page from the preview feature.
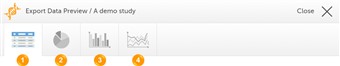
- To access the preview feature, click Preview. A window appears that contains the following tabs (see image): 1. Data, an overview of the selected data in a table. 2. Pie chart, where you can create pie charts of various data sets. 3. Column chart, where you can create column charts of various data sets. 4. Line chart, where you can create line charts of various data sets. Note! The preview button is only available when you have selected Excel or CSV as output format for export. The preview is not available when the one row per item is selected.
- Tip! Accessing a subject via the launch icon locks the subject for other users. Use the preview feature when you want to review data without occupying the subject for anyone else.
2 Data table
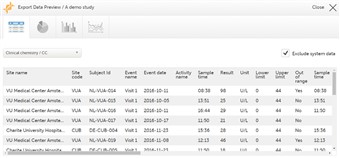
- In the data tab, you can preview the data in table format.
- If you have chosen to group the data by form (see chapter Output format and export in the eLearning section about Data export), you can select from which form the data should be displayed in the drop down menu.
- To exclude system data from the table (for example site sequence number, subject sequence number, design version or code list data), click Exclude system data.
- Click any data point in the table to view the underlying form.
3 Pie chart
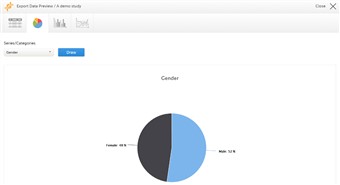
- In the pie chart tab, you can create pie charts of the data. Select the data set you wish to plot in a chart, and click Draw.
- If you have chosen to group the data by form, you can only choose data sets from the form you have selected in the data table tab.
- Click any data point to view its details.
- You can easily save the graph or send it by e-mail. • Click Save this chart to download a PDF file of the chart. • Click Email this chart to send a PDF file of the chart to your own e-mail address.
4 Column chart
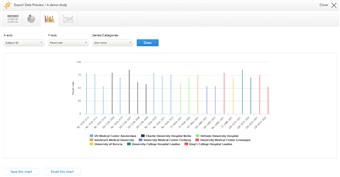
- In the column chart tab, you can create column charts of the data. Select which data you would like to plot on the X-axis and Y-axis, which series should be created, and click Draw.
- If you have chosen to group the data by form, you can only choose data sets from the form you have selected in the data table tab.
- Click any column to view details of the data.
- You can easily save the graph or send it by e-mail. • Click Save this chart to download a PDF file of the chart. • Click Email this chart to send a PDF file of the chart to your own e-mail address.
5 Line chart
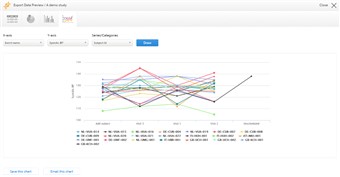
- In the line chart tab, you can create line charts of the data. Line charts are created in a similar fashion as column charts.