Curriculum 'Monitor Training Program (V4)'
Overview of the landing page Download PDF
1 Let's get started!
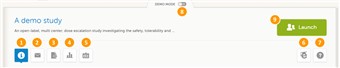
- The start page of every study contains the following icons that give access to different features, or enable you to view information about the study (see image). 1. Study status 2. Messages 3. Export of data 4. Metrics 5. Roles 6. eLearning 7. Support 8. Demo mode ON/OFF 9. Launch button The icons are described one by one below.
2 Study status (1)
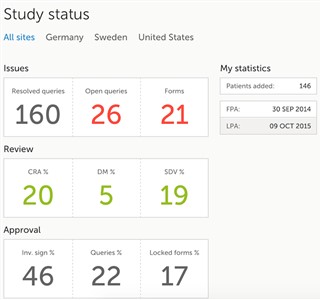
- The first page that is shown when accessing a study is the study status page. This page gives you an overview of the progress of the study - on study, country and/or site level (depending on which sites you have access to).
- The information provided in the boxes show important metrics, such as: • the number of open queries • the number of forms with issues • the amount of work performed (in percentage) by different user roles • the amount of data signed • when last signing was performed, actual recruitment etc.
- You can filter the displayed data for country or site by clicking the name of the country or site.
3 Messages (2)
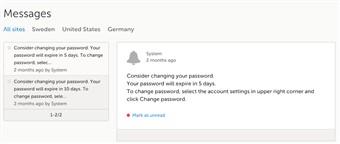
- A message can either be a system message or a study message. An example of a system message is "Your password is about to expire". An example of a study message is "A serious adverse event has been added to the study".
- Study messages that are judged important are normally configured to be sent also as emails.
- An indicator in the top bar of the application indicates whether you have unread messages.
4 Data Export (3)
- The data export page enables you to review and download study data in various formats, such as Excel, CSV, SAS, PDF and CDISC ODM. You can export a selection of the data by setting the scope of the export.
- There are two ways of getting access to the data: • Using the preview feature, which enables you to see the data directly on the screen and to generate different kinds of graphs. You can also directly access the underlying eCRF pages from the preview feature. • By exporting the data to an external file for further analysis.
- Tip! If you are interested in data from a certain point in time, like yesterday, use the time period selector under Events and time period. Here you can choose to only review and export the data that was added or edited during the selected time period. This is especially useful if you want to see all new and changed data since for example your last monitoring visit.
- For more information about data export, see the Data export section in the eLearning.
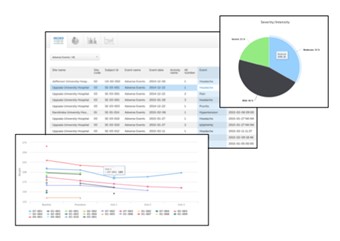
5 Metrics (4)
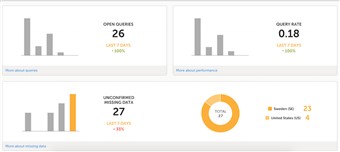
- The metrics feature gives an overview of the quality of data in terms of open queries and missing data. You can filter the displayed data by country and site to monitor the performance.
- The metrics graphs depict: • open queries • query rate • number of unconfirmed missing data items. The column graphs show five bars indicating the trend during the past five weeks, where each bar indicates a seven day period. The orange bar depicts the most recent seven days, starting from today. The grey bars depict earlier 7-day-periods. The percentage indicates the trend of the recent seven days as compared to the previous 7-day-period. For example, +10% means that in the recent seven days, 10% more queries were in the state 'raised' as compared to the previous 7-day-period.
- Click More about [...] to open a page with detailed metrics about queries, performance or missing data. All detailed metrics pages include filtering possibilities and a bar to show the review status.
- You can save all detailed metrics graphs in PDF format and download the PDF for sharing. You can also send an email to your registered e-mail address with the PDF file as attachment.
- Please observe! The rates give you the possibility to compare sites with each other as the number of queries and the number of missing data points are divided with the number of patients on the site.
6 Roles (5)
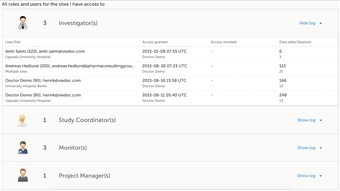
- The Roles page provides information on the roles that are assigned to you. It also lists all the roles that are, or have been, used at the sites you have access to.
- To see user details of each role, click Show log. The log displays:
• name of the user, e-mail address and site,
• when and by whom access was granted,
• when and by whom access was revoked (if applicable),
• whether the user edited any data, and and the total number of login sessions* by the user.
*number of sessions is defined as number of times a user has accessed the study. - How is the information in the log useful? Let's say you would like to know who logged in and contributed to the data. Or you would like to make sure that no access has been given to users that should not have access, or check whether access has been correctly revoked for a user that was given temporary access.
7 eLearning (6)
- Under this section you have access to what you are reading right now, the eLearning.
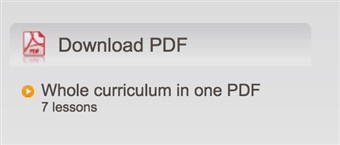
Depending on the roles that have been assigned to you, you might have access to several eLearning programs. - Tip! The various lessons in the eLearning can easily be compiled into a PDF and printed if you need to store them in the investigator binder.
8 Support (7)
- Click the support icon to open a pop-up with contact details to the users that can help you in case you need support. Normally your name is visible to the site users as the monitor typically is the first point of contact to the site.
9 Demo mode (8)
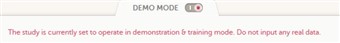
- As a monitor, you need access to a training environment where you can train yourself and others. You can easily switch between demo/training mode and production mode using the demo mode switch. Set the demo mode switch to the I position to switch to the demo mode and start the training (see image). Set the demo mode switch back to the O position when you are done with the training.
- The demo/training mode is clearly indicated with demo icons. Make sure you do not enter any real data in demo/training mode!
- Access to a training environment can also be given to the site users (that are assigned to clinic roles such as investigator or study nurse). The access to the training environment can later be revoked if not necessary anymore.
- Note! If you are a site manager you can handle these invitations yourself. If you are not a site manager, contact the study manager for assistance.
10 Launch study (9)
- Click the Launch button to access the patient data and eCRFs.